
High-fidelity collection under response pressure.
Execute YARA-L scans, memory capture, artifact collection, process inspection, and evidence packaging across distributed assets without waiting for a perfect management path.
xAIDRA gives responders real-time Linux kernel telemetry, remotely distributed detection logic, intelligent job execution, and decentralised forensic capture across embedded network appliances, Linux infrastructure, and Android fleets.
Advanced malware and skilled operators often target embedded network and security appliances because they are trusted, operationally sensitive, and poorly covered by conventional endpoint tooling.
Execute YARA-L scans, memory capture, artifact collection, process inspection, and evidence packaging across distributed assets without waiting for a perfect management path.

Run targeted jobs when telemetry indicates suspicious process creation, resource anomalies, network activity, signature mismatches, known malware, or IOC matches.
xAIDRA is for teams responsible for systems that are critical, constrained, remote, or difficult to instrument. It gives analysts a way to ask direct forensic questions of live assets while preserving control over when collection happens and what evidence is returned.
SOC and detection teams
Validate whether a signal maps to a real process, file, network flow, IOC, or signature mismatch on the affected system.
DFIR teams
Acquire logs, memory, files, process details, and network observations before volatile evidence disappears or an appliance is rebuilt.
Infrastructure owners
Extend investigation coverage into embedded Linux, network appliances, edge systems, cloud nodes, and managed Android devices.
xAIDRA helps incident responders move from uncertainty to evidence by combining live telemetry, controlled remote execution, forensic artifact capture, and threat intelligence context in one operating model.
01 / Threat Hunting
Inspect process creation, command lines, network flows, file artifacts, resource anomalies, signature mismatches, and IOC hits across systems that are often outside traditional EDR coverage.
02 / Incident Response
Send targeted collection and detection tasks to affected nodes based on conditions, alerts, telemetry, or analyst judgement instead of running broad, noisy scans everywhere.
03 / Forensics
Capture memory, logs, process state, suspicious files, network observations, and structured job results with a repeatable evidence path suitable for later review.
04 / Embedded Recovery
Use decentralised capture options over UART, root shell, or LuaJIT-assisted collection paths to recover artifacts from constrained network and security appliances.
xAIDRA is built around the way investigations actually unfold: establish visibility, trigger focused collection, preserve results, then use those findings to improve future detection and analysis.
Step 01
Enroll an agent, run a mobile audit, or use a decentralised capture path when the target is an appliance or constrained host.
Step 02
Stream kernel, process, network, resource, mobile, and IOC telemetry into a control plane designed for rapid triage.
Step 03
Dispatch YARA-L scans, file collection, memory capture, process review, network analysis, or custom Lua/Python/bytecode logic.
Step 04
Convert scan results, alert telemetry, and forensic summaries into searchable intelligence for future RAG-assisted analysis.

Coverage for server, cloud-native, and embedded Linux environments with visibility into kernel state, process integrity, network behavior, and appliance-level response workflows.

Forensic-focused visibility into mobile devices, application permissions, suspicious software clusters, radio conditions, network observations, and handset-level telemetry for field investigations.
Recent mobile releases extend xAIDRA beyond app-only auditing. Operators can now inspect GNSS integrity, map RF detections in space, compare audit drift across runs, and separate likely false positives from genuinely actionable mobile findings.
GNSS Analyzer
Skyplot inspection, strongest-satellite review, C/N0 trend analysis, and receiver-state diagnostics for navigation trust assessment.
RF Survey Map
Map-backed Wi-Fi, BLE, and Bluetooth survey overlays with proximity estimation, target separation, and authorized-node comparison workflows.
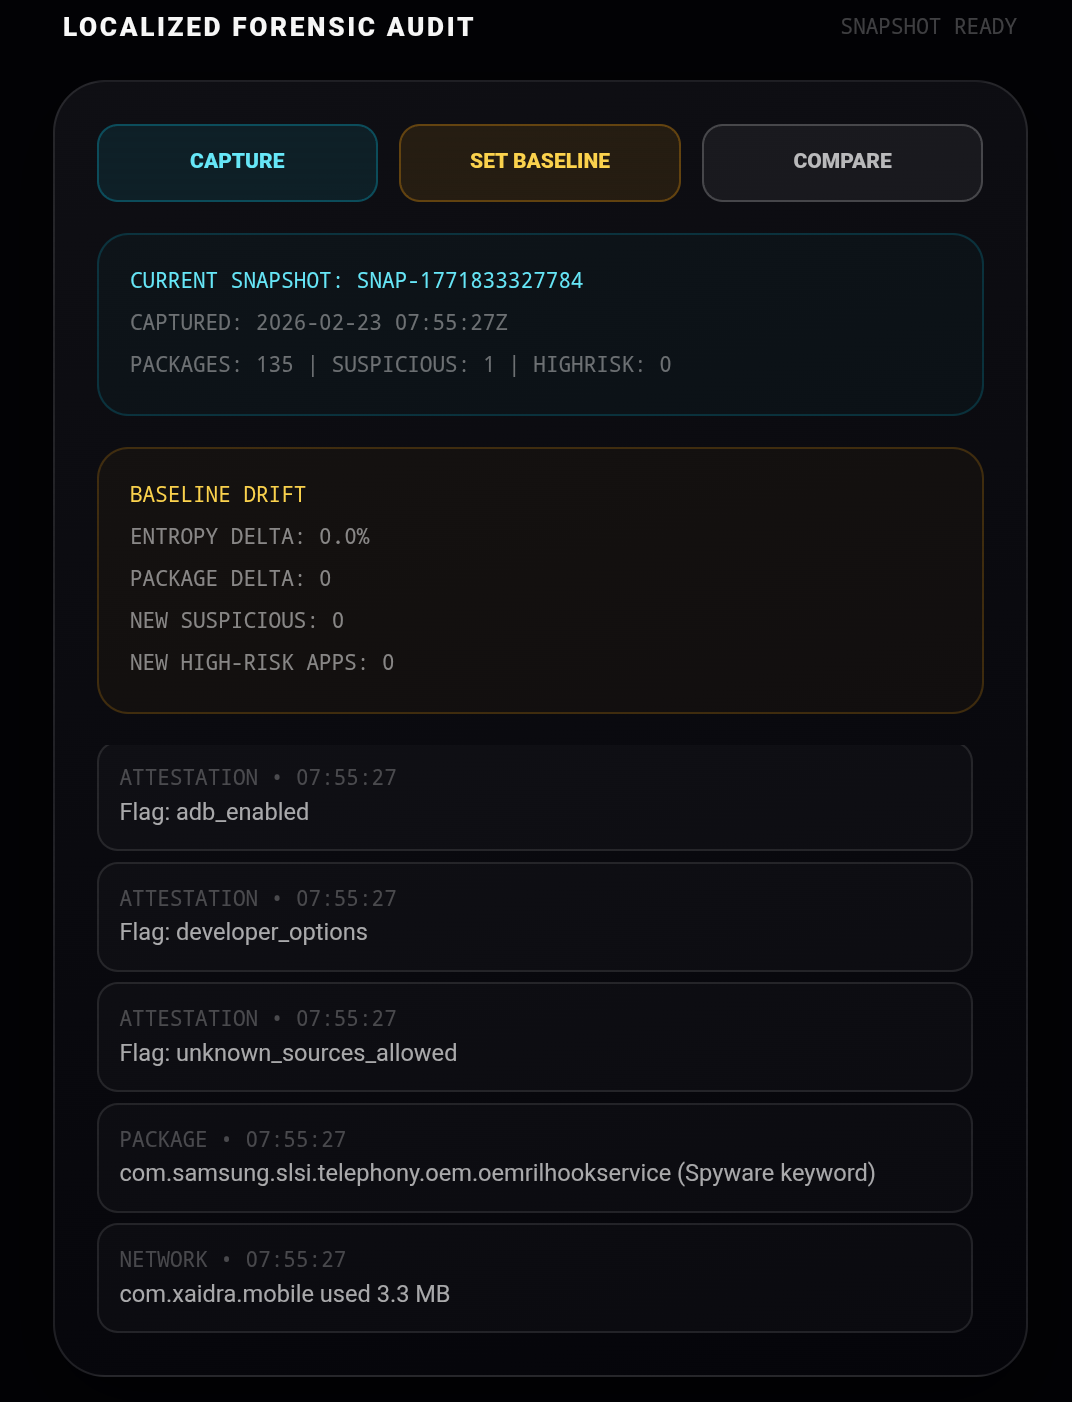
Permission Audit
App provenance, change detection, remediation-first findings, and OEM-aware suppression reduce noise and make repeated audits operationally useful.
EMT / EMF
Signed axis polarity, calibrated magnetic variance, and honest handset-sensor boundaries for local anomaly assessment.
The mobile app now supports a tighter operator loop: detect suspicious app or device drift, correlate surrounding radio activity, inspect GNSS conditions, and preserve actionable evidence without leaving the handset workflow.
Offline Continuity
Bundled CVE and IOC data keep mobile scans useful when connectivity is constrained.
False-Positive Control
Known OEM and system packages are handled through review-aware logic instead of being overstated as malicious.
// Hover to identify — click to expand
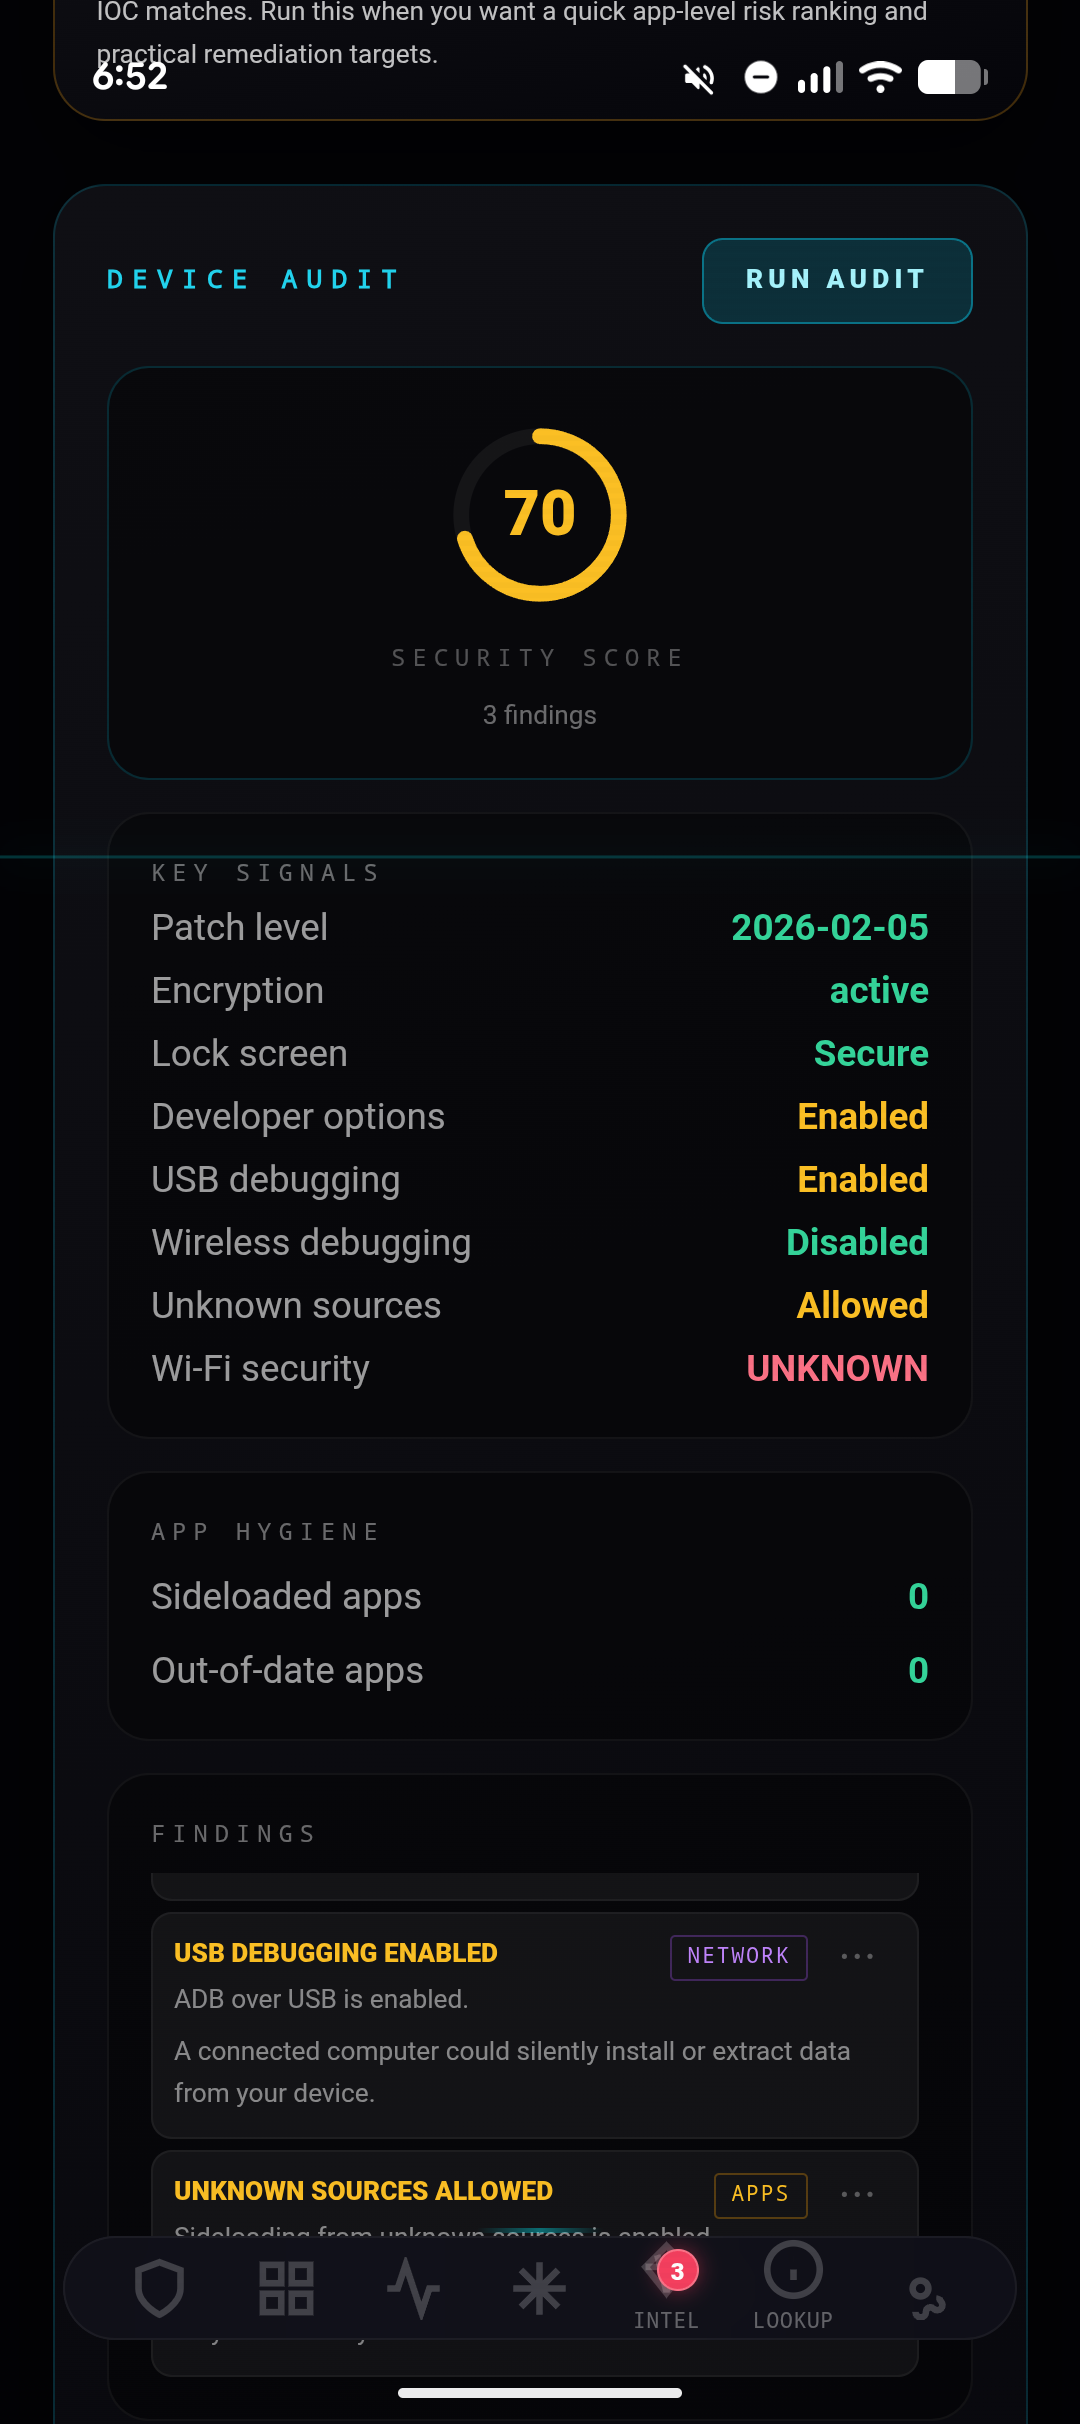
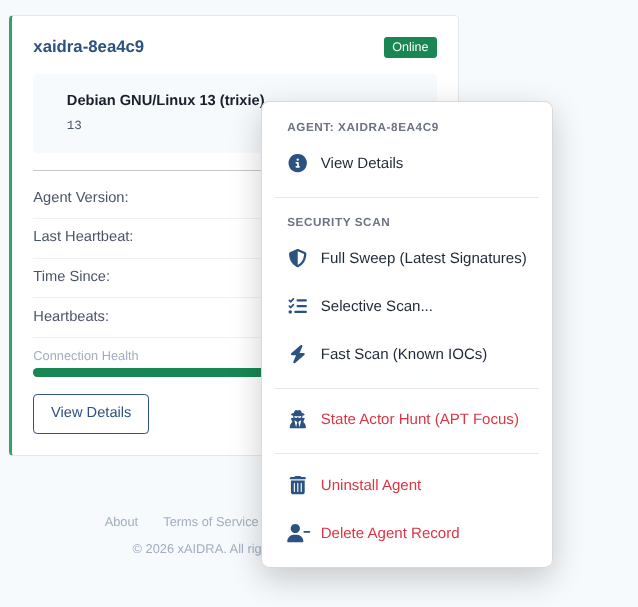
// DASHBOARD
Device posture and quick access to core response modules.
// FAST_SCAN
Phase-based scan pipeline for artifacts, IOC matches, and attestation.
// INTEL_CENTER
Alert triage with acknowledgement and resolution workflows.
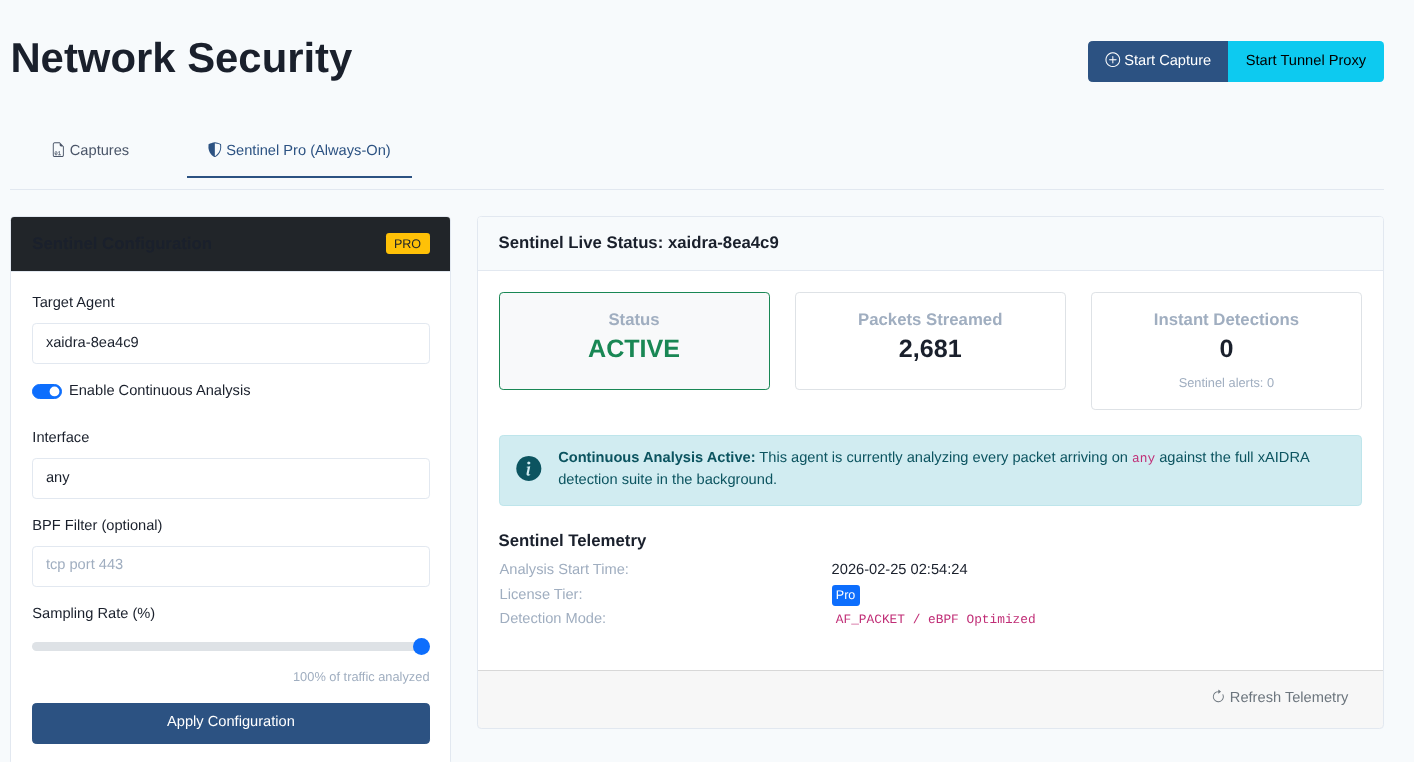
// THREAT_MONITOR
Live IOC sweep against network activity during active sessions.
// APP_PERMISSIONS
Permission-risk and audit findings for installed mobile apps.
Onboard Linux nodes in seconds with a single curl command. Ideal for rapid response in unmanaged environments.
Deploy via Kubernetes sidecars or Ansible for full-scale infrastructure protection and policy enforcement.
Enroll Android assets via our dedicated mobile app to bridge the gap between corporate IT and field operations.
Integrate xAIDRA triggers into your existing SOAR or SIEM platforms for automated forensic capture.
We understand that incident response doesn't always happen in a perfectly managed environment. xAIDRA is designed to be deployed exactly where and when you need it, from single critical nodes to global clusters.
Under the hood, xAIDRA combines trusted kernel telemetry, secure detection bundle distribution, and pluggable analysis engines so responders can collect evidence without destabilising the systems they are investigating.
xAIDRA uses eBPF to observe kernel events without kernel modules, system binary modification, or reboot-driven deployment. Event streaming through ring buffers keeps telemetry timely while preserving low overhead collection.
LLM-assisted detection engineering helps convert threat intelligence and response findings into versioned detection logic that can be reviewed, packaged, and distributed to agents when the investigation requires it.
Detection logic is shipped as timely, remote, encrypted bundles with signature version tracking, allowing responders to update what agents know without rebuilding the endpoint or interrupting operations.
The analysis runtime supports Lua, Python, YARA-L, bytecode, and eBPF-backed checks, giving teams a practical path from simple IOC matching to deeper behavioral and forensic logic.
xAIDRA integrates Retrieval Augmented Generation so completed scans, critical alerts, and forensic summaries become searchable knowledge for future investigations instead of isolated case notes.
Automated learning
Security scan results are converted into technical summaries containing risk scores, suspicious processes, malicious flows, IOC matches, and other analyst-useful evidence before synchronization into the Vertex AI RAG corpus.
Domain optimized
ForensicModellerService formats telemetry into human-readable intelligence documents designed for retrieval, modeller training, and technical reasoning over prior observations.
Real-time integration
RealtimeUpdateService manages RAG sync tasks in the background so the corpus stays current while the dashboard and job workflows remain responsive during active incidents.
// Hover to identify — click to expand
// ACTIVE_NETWORK
Live network connection map across all monitored nodes.
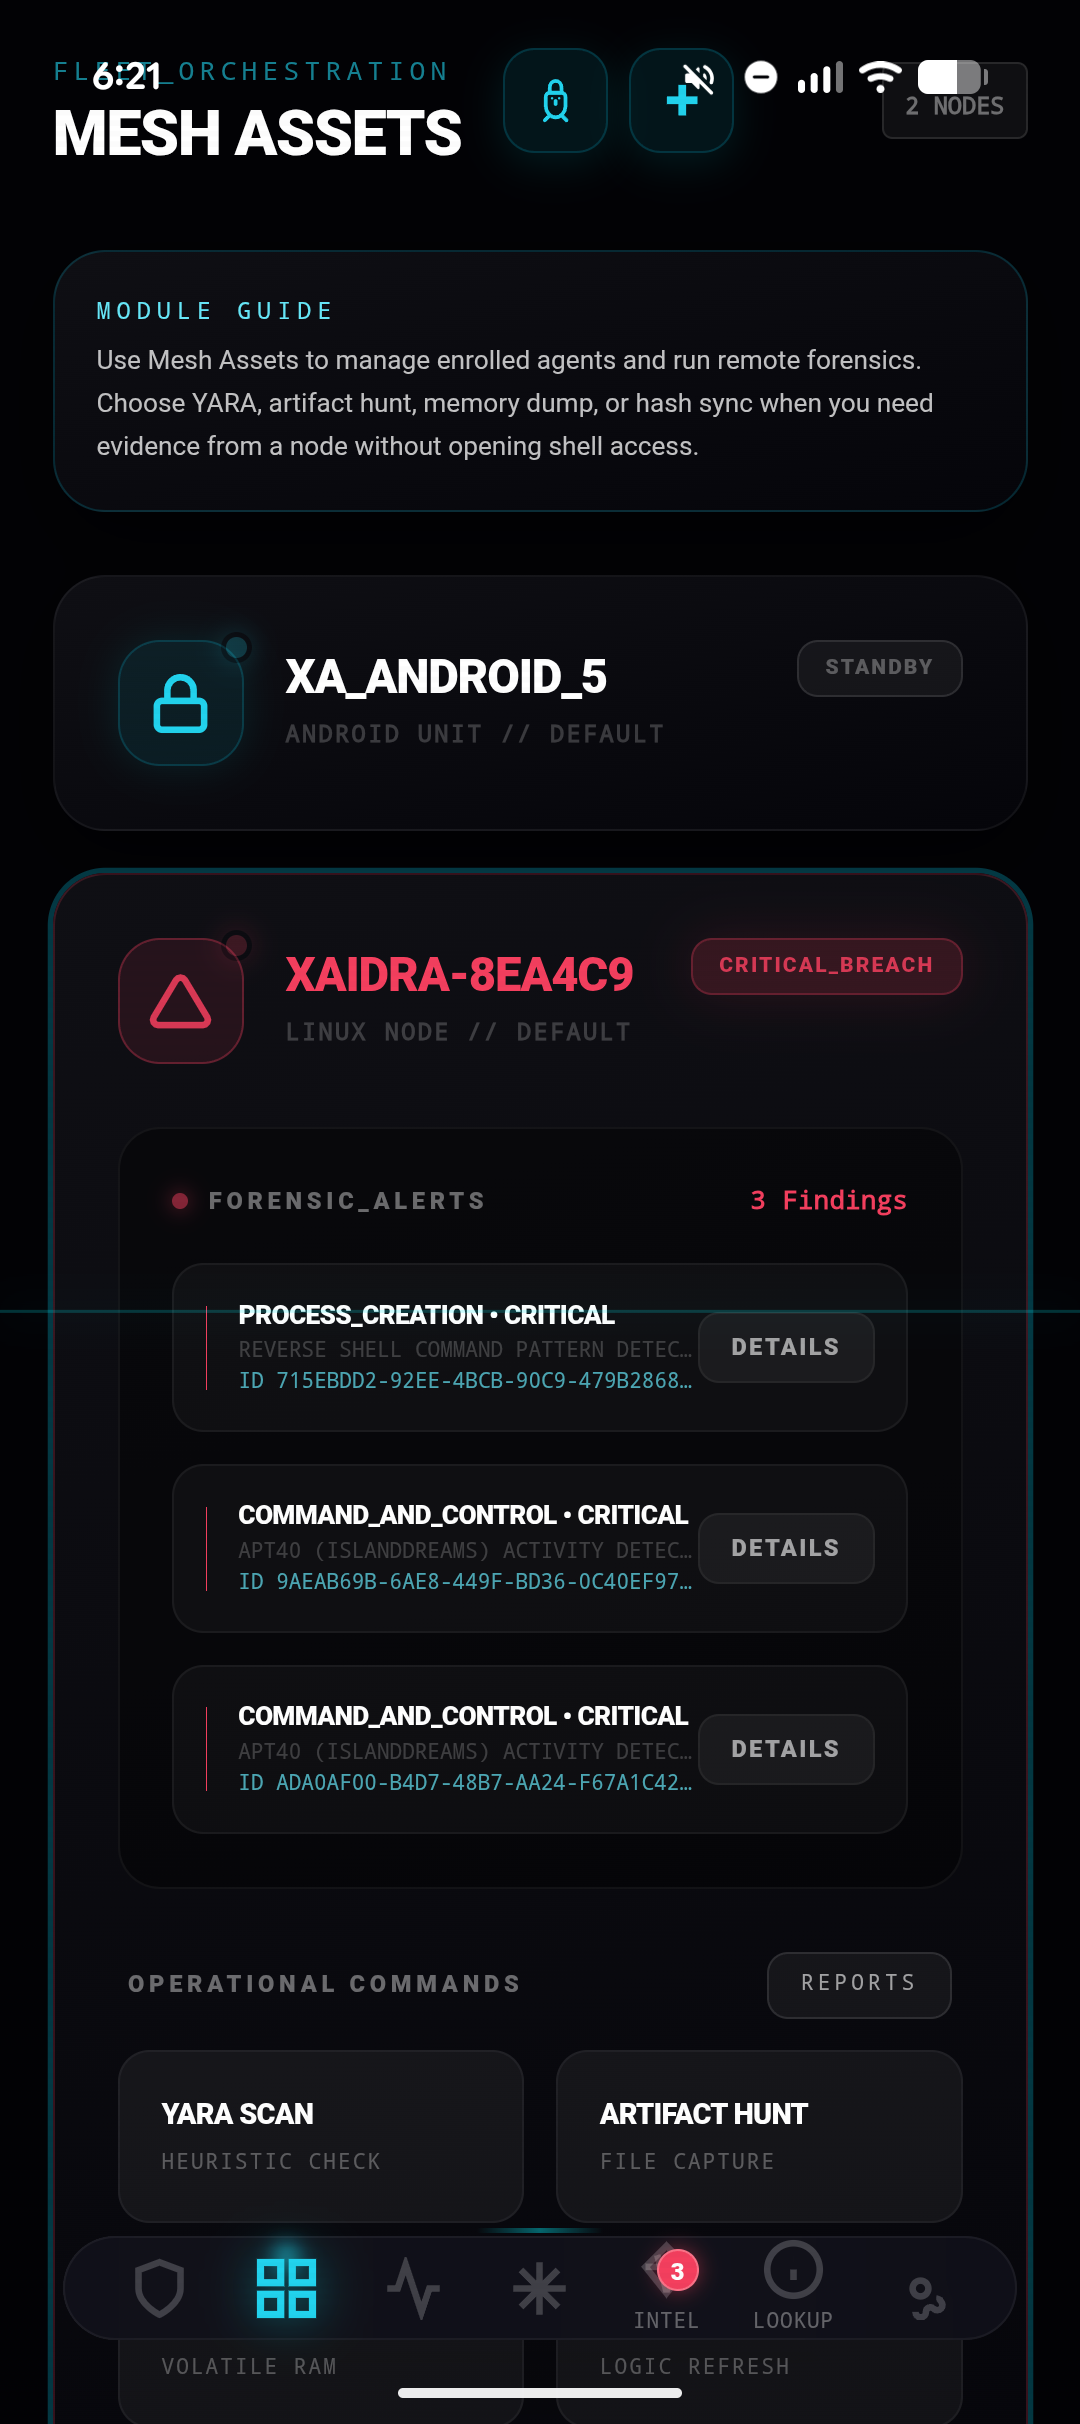
// ALERT_TRIAGE
Real-time signature matching and severity ranking across the mesh.
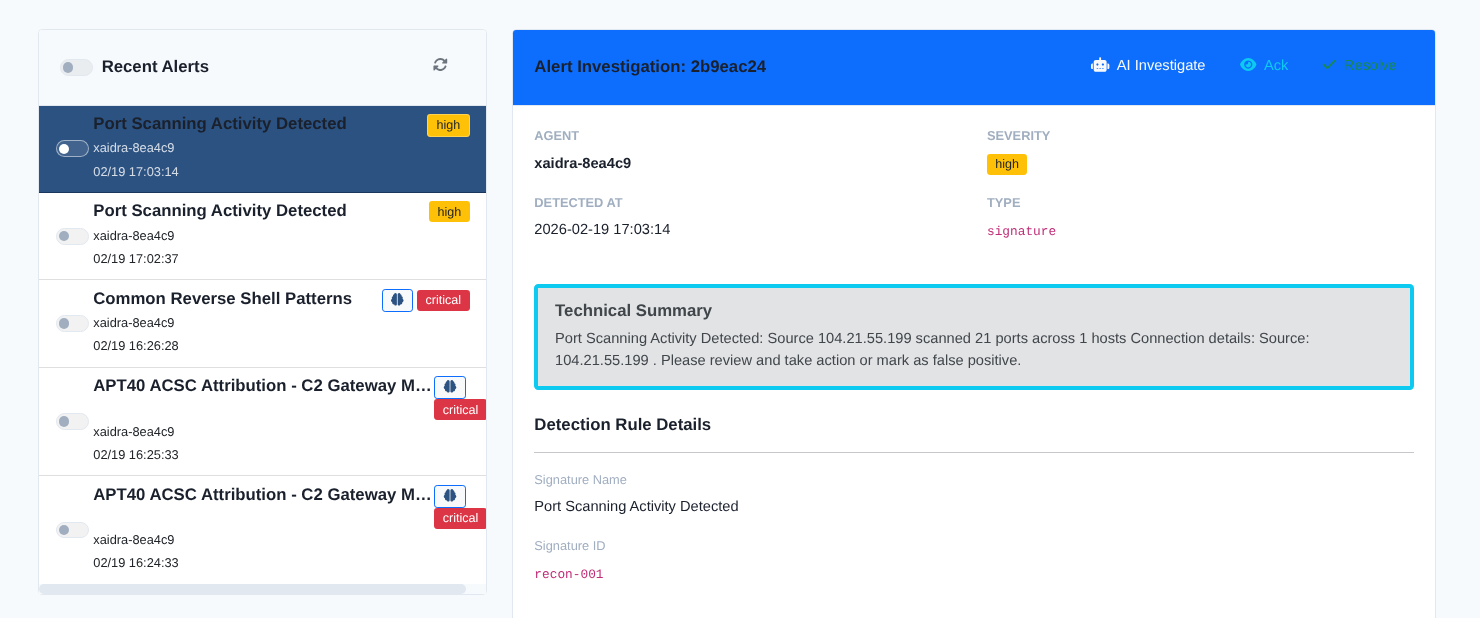
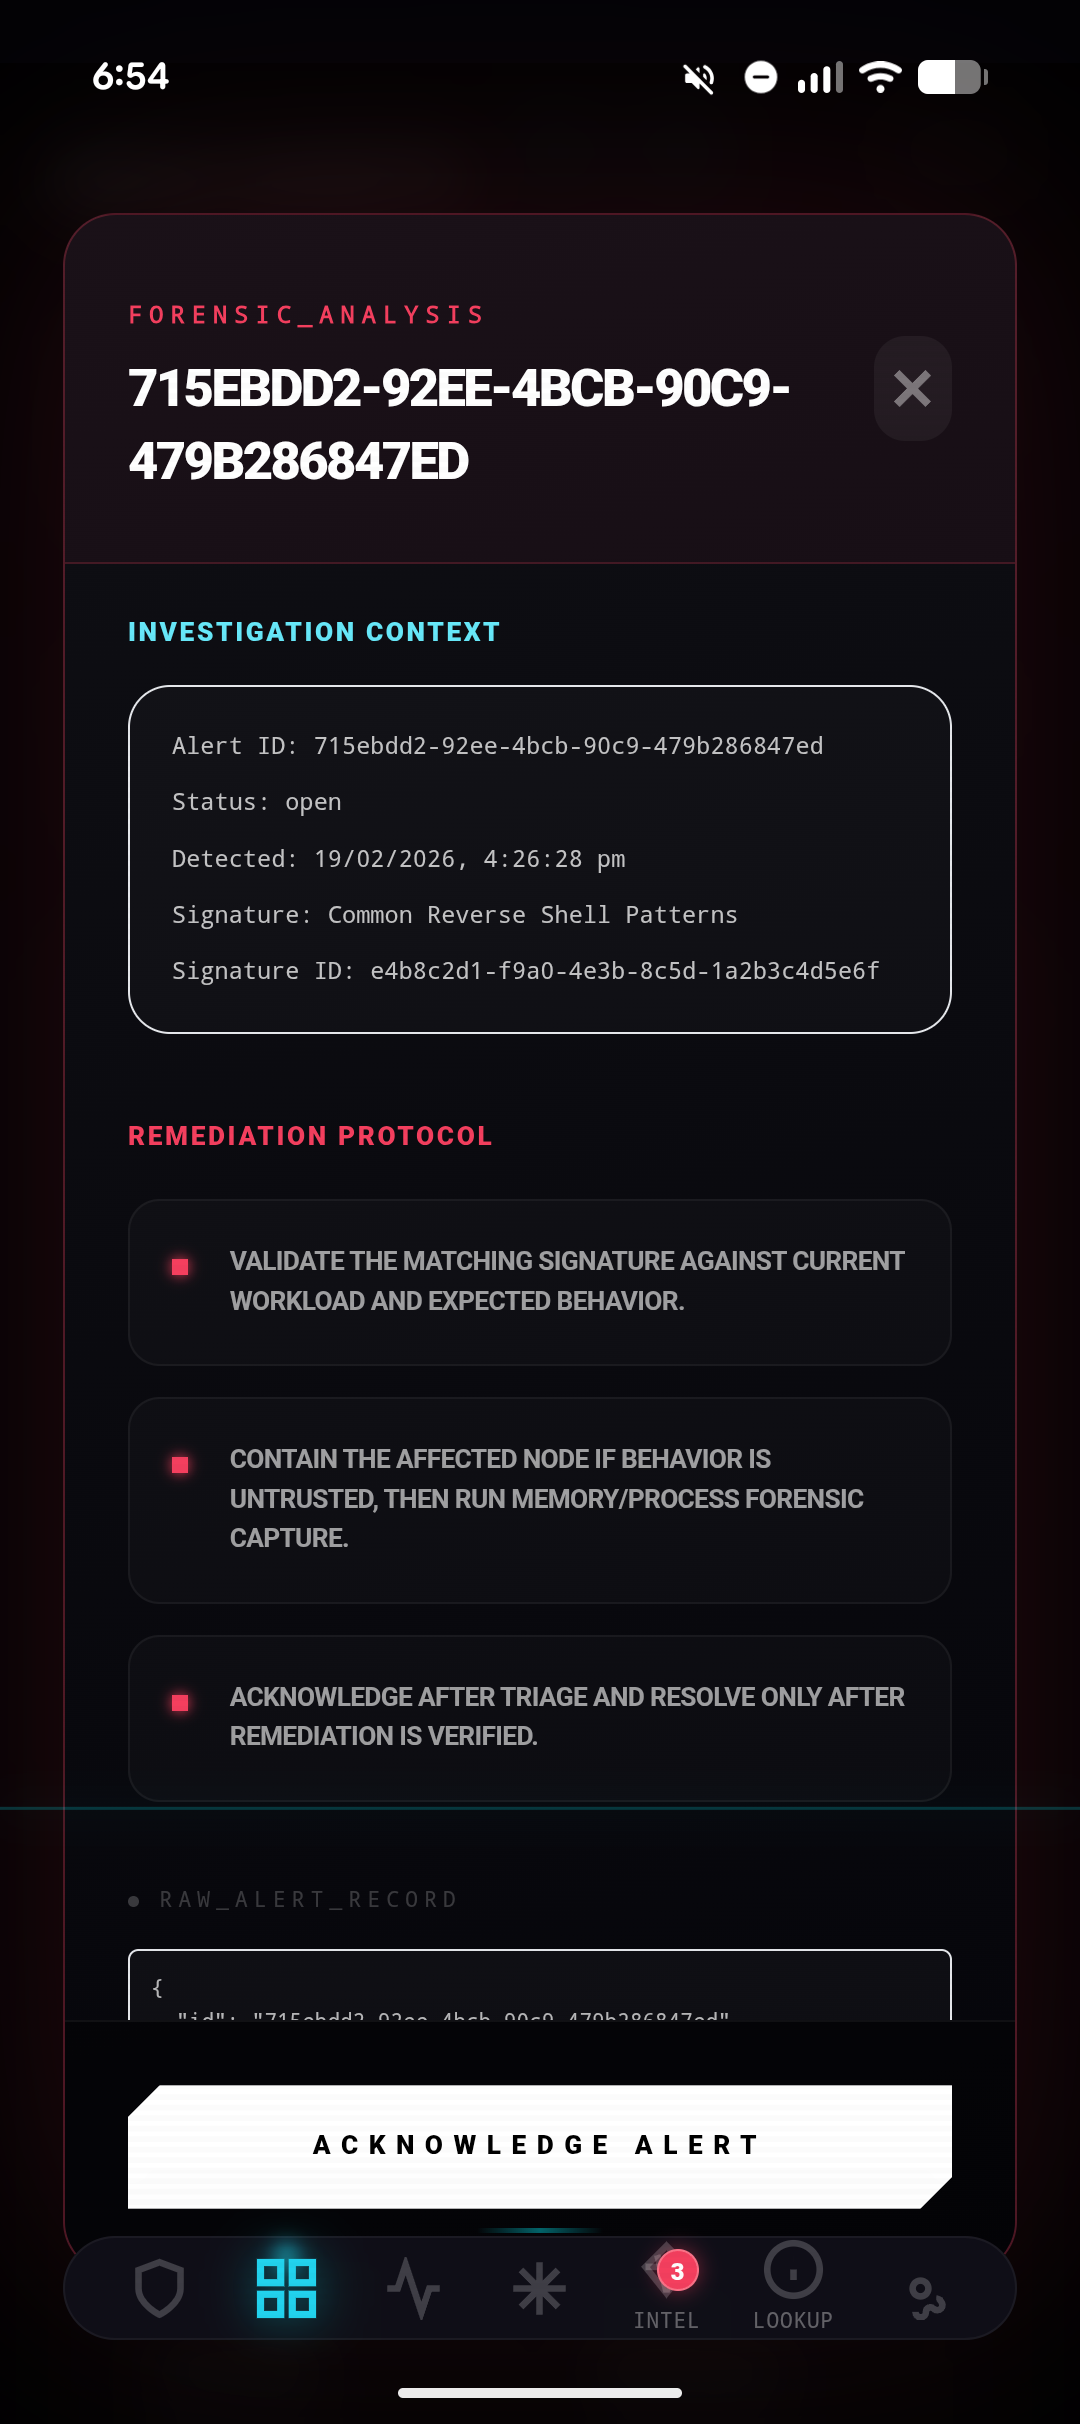
// ALERT_DETAIL
Drill-down forensic context and IOC correlation per alert.
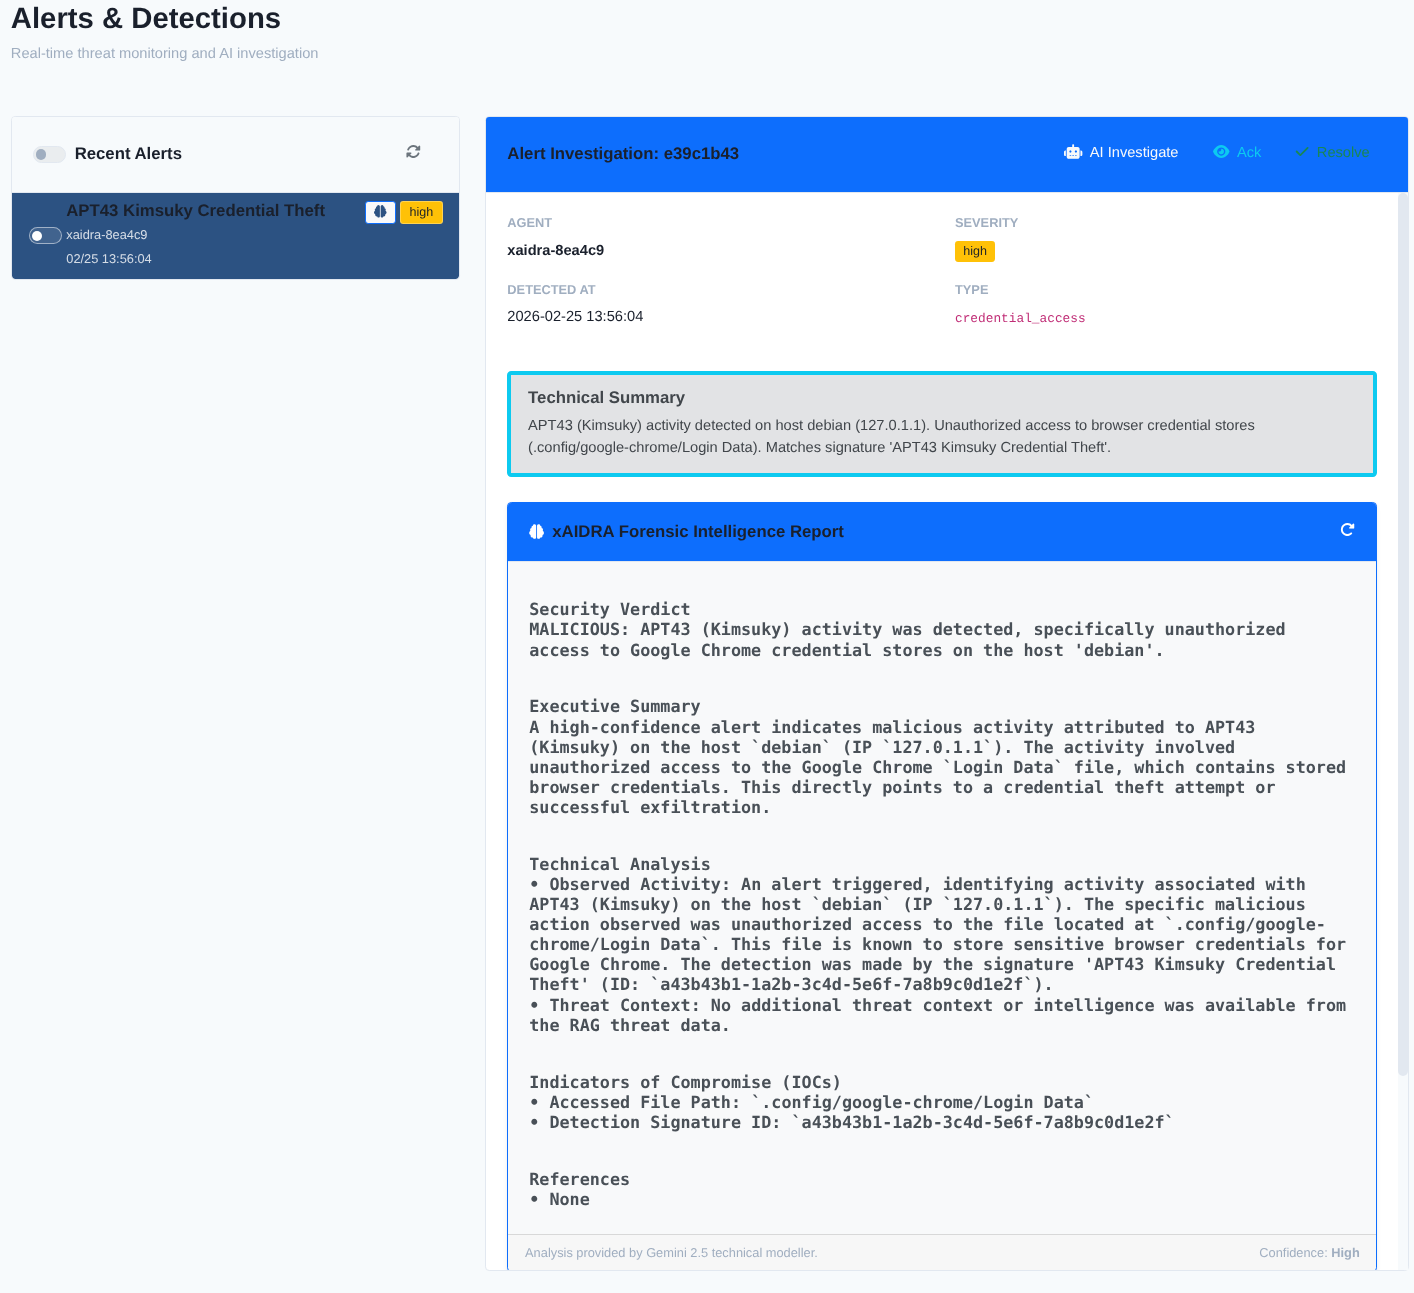
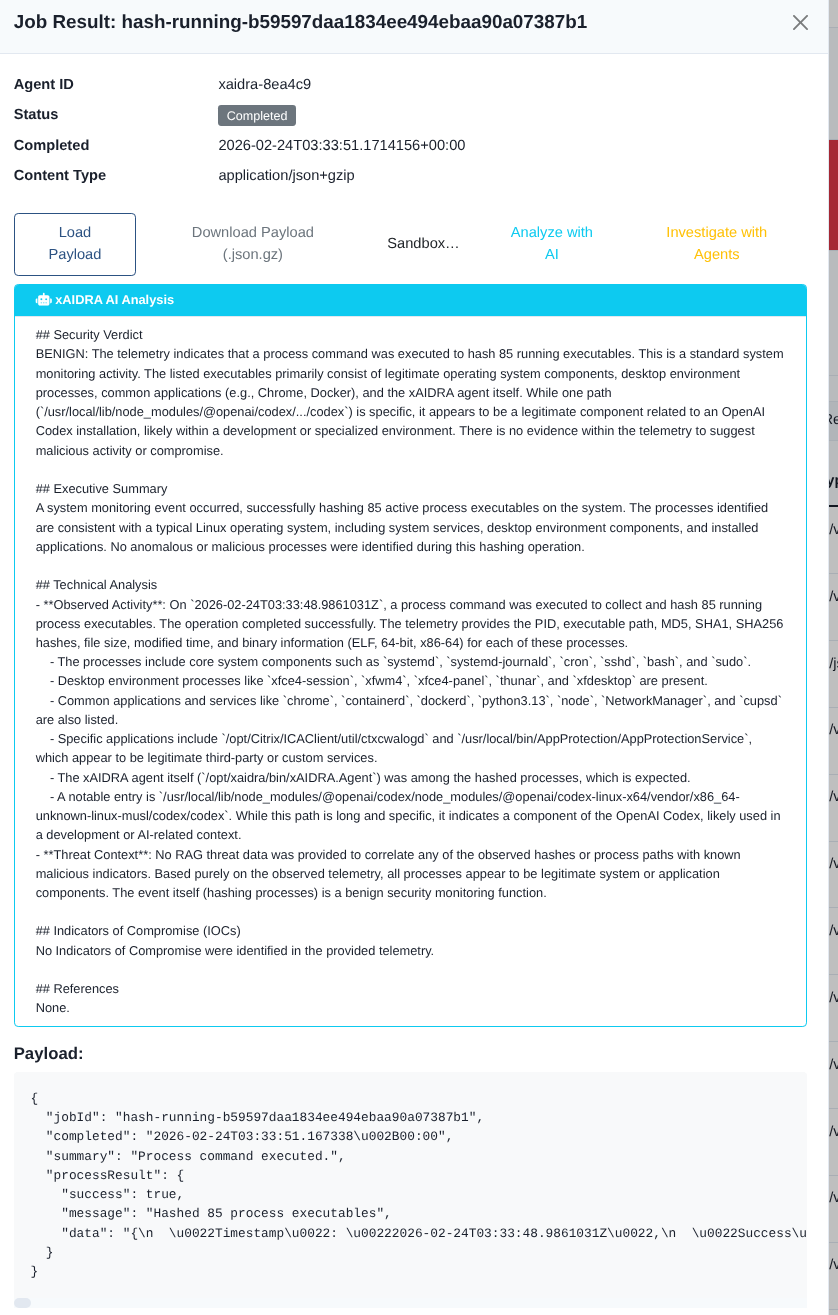
// AI_ANALYSIS
Automated threat context and narrative generated from live telemetry.
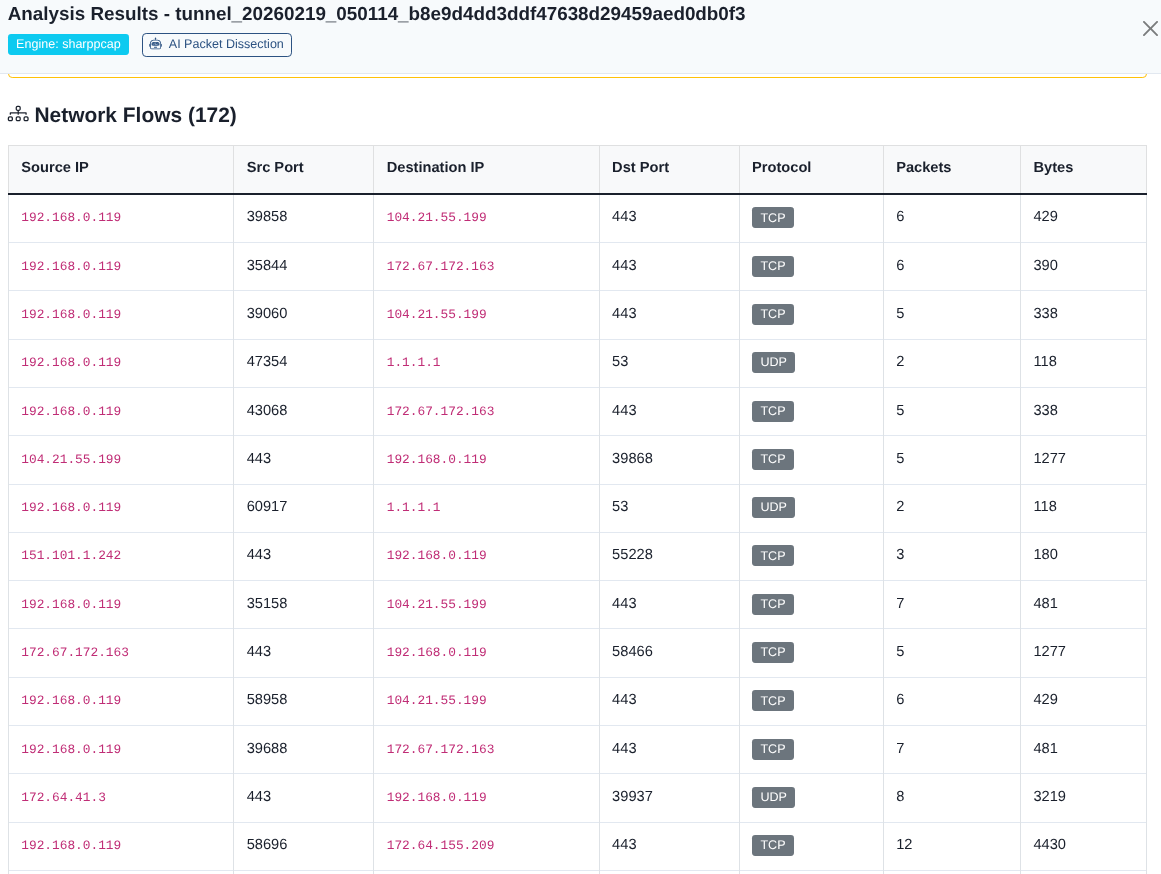
// TRAFFIC_ANALYSIS
Deep packet inspection and source-to-destination flow mapping.
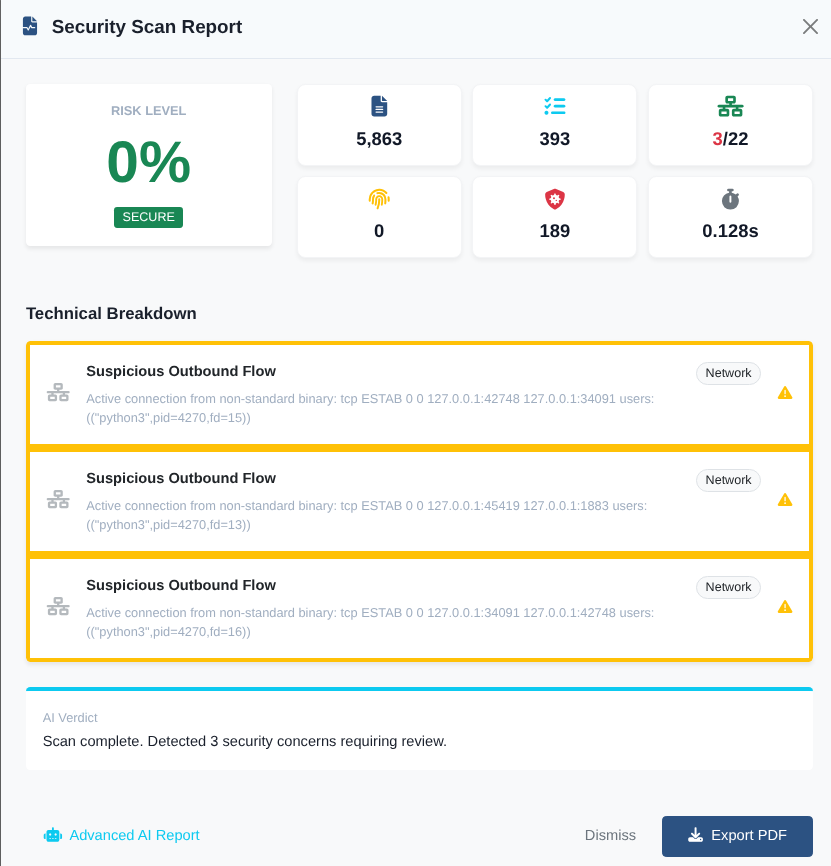
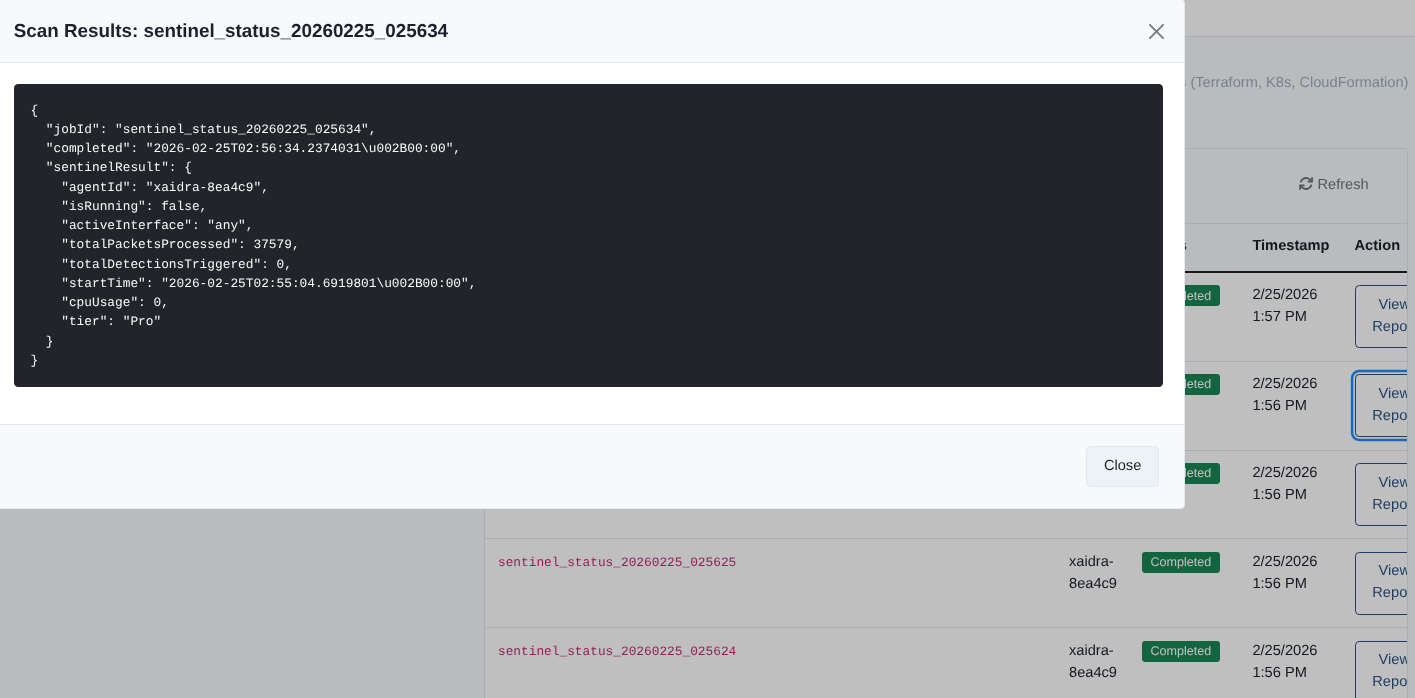
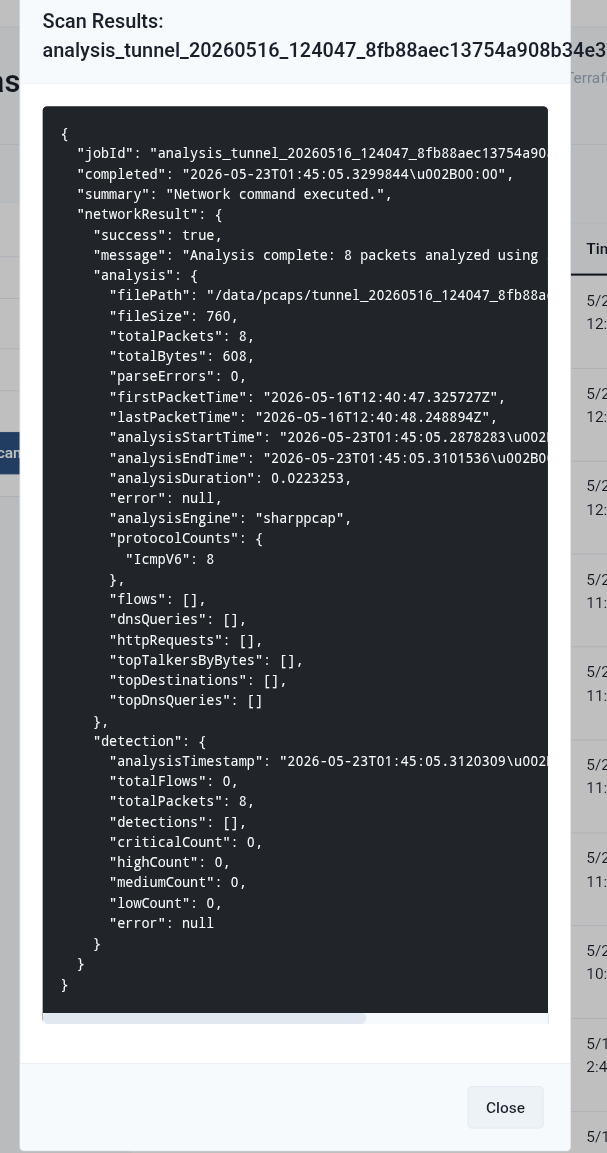
// SCAN_REPORT
Full artifact collection and YARA scan results for a single node.
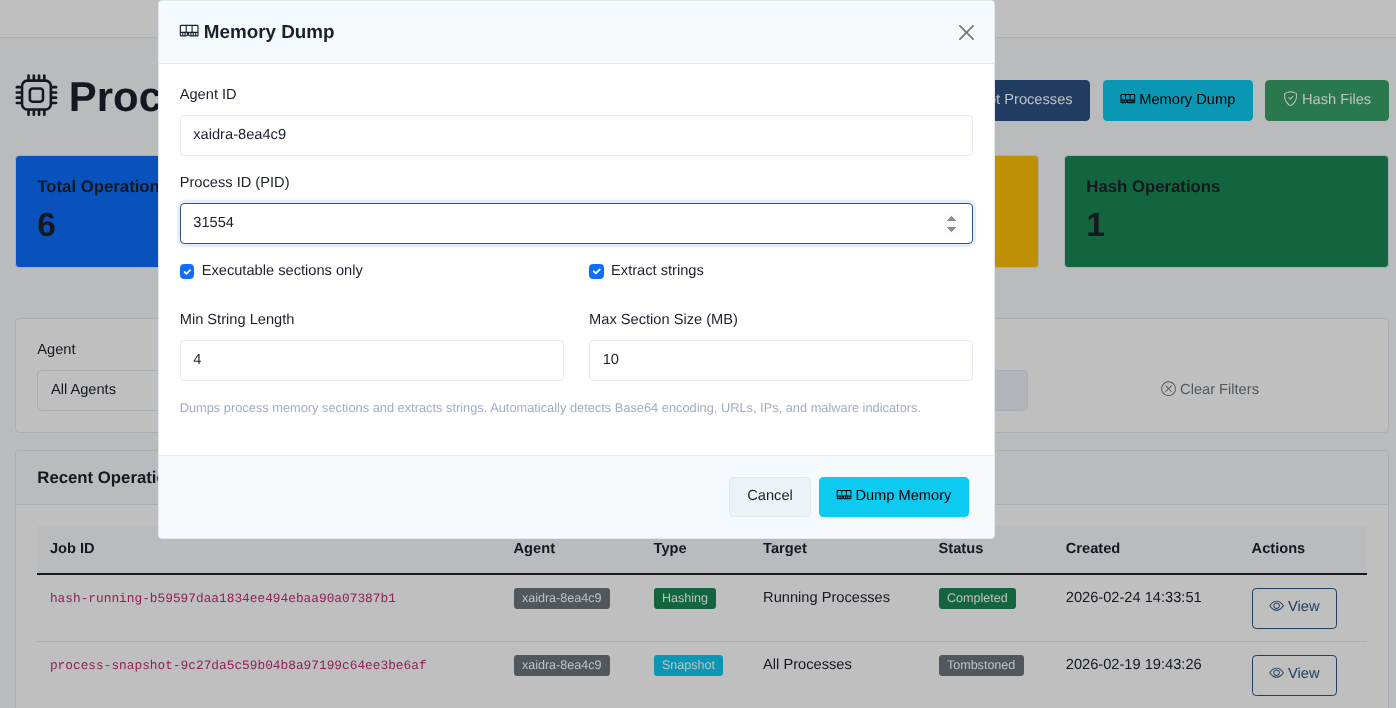
// MEMORY_FORENSICS
Remote memory acquisition and volatile evidence capture.
// VERBOSE_LOG
Raw agent telemetry stream for deep triage and manual review.
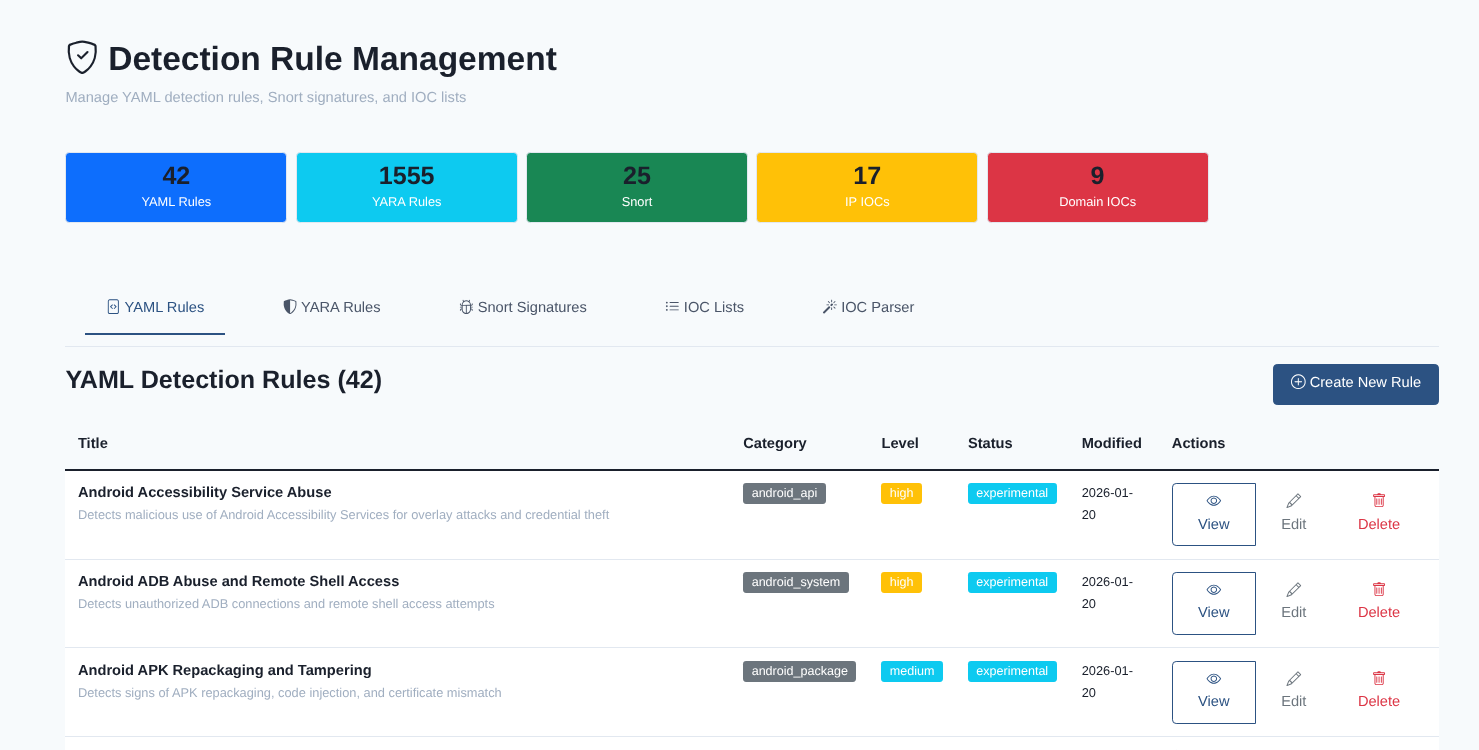
// DETECTION_RULES
Custom YARA and behavioural rule management across the fleet.
// JOB_QUEUE
Dispatch and track forensic jobs across distributed nodes in real time.
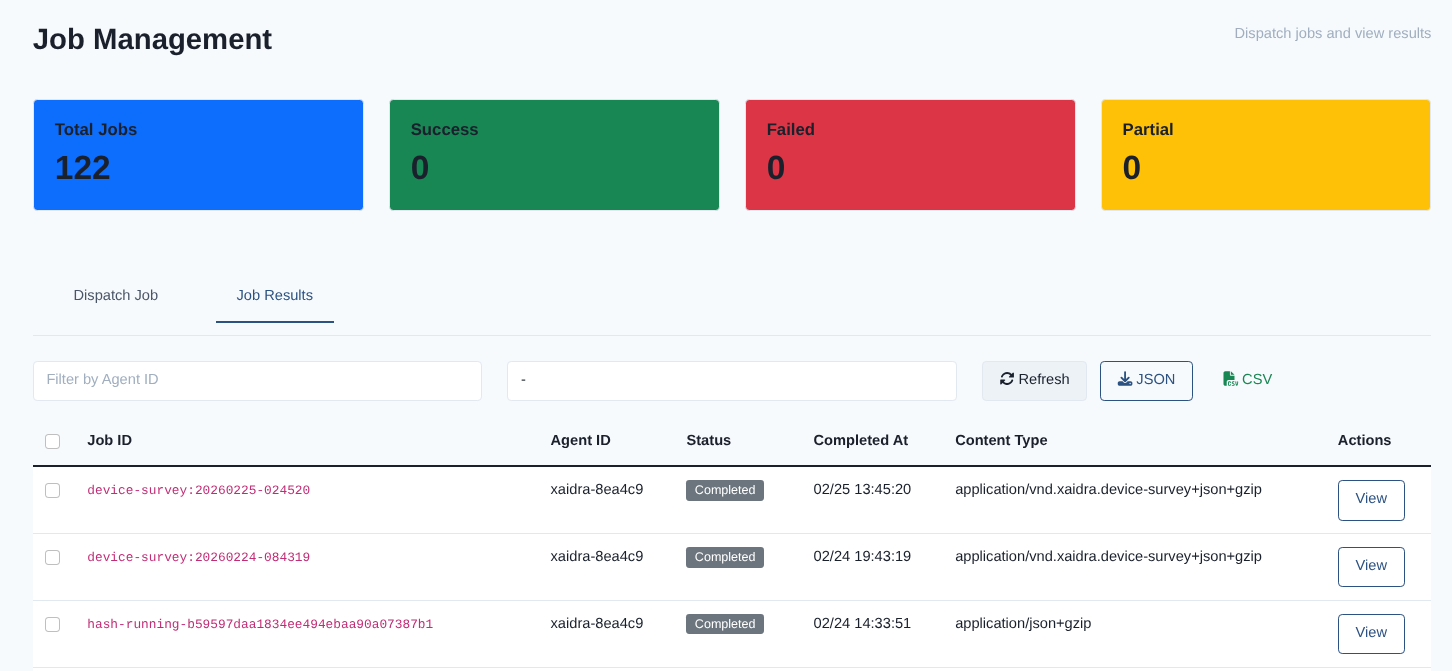
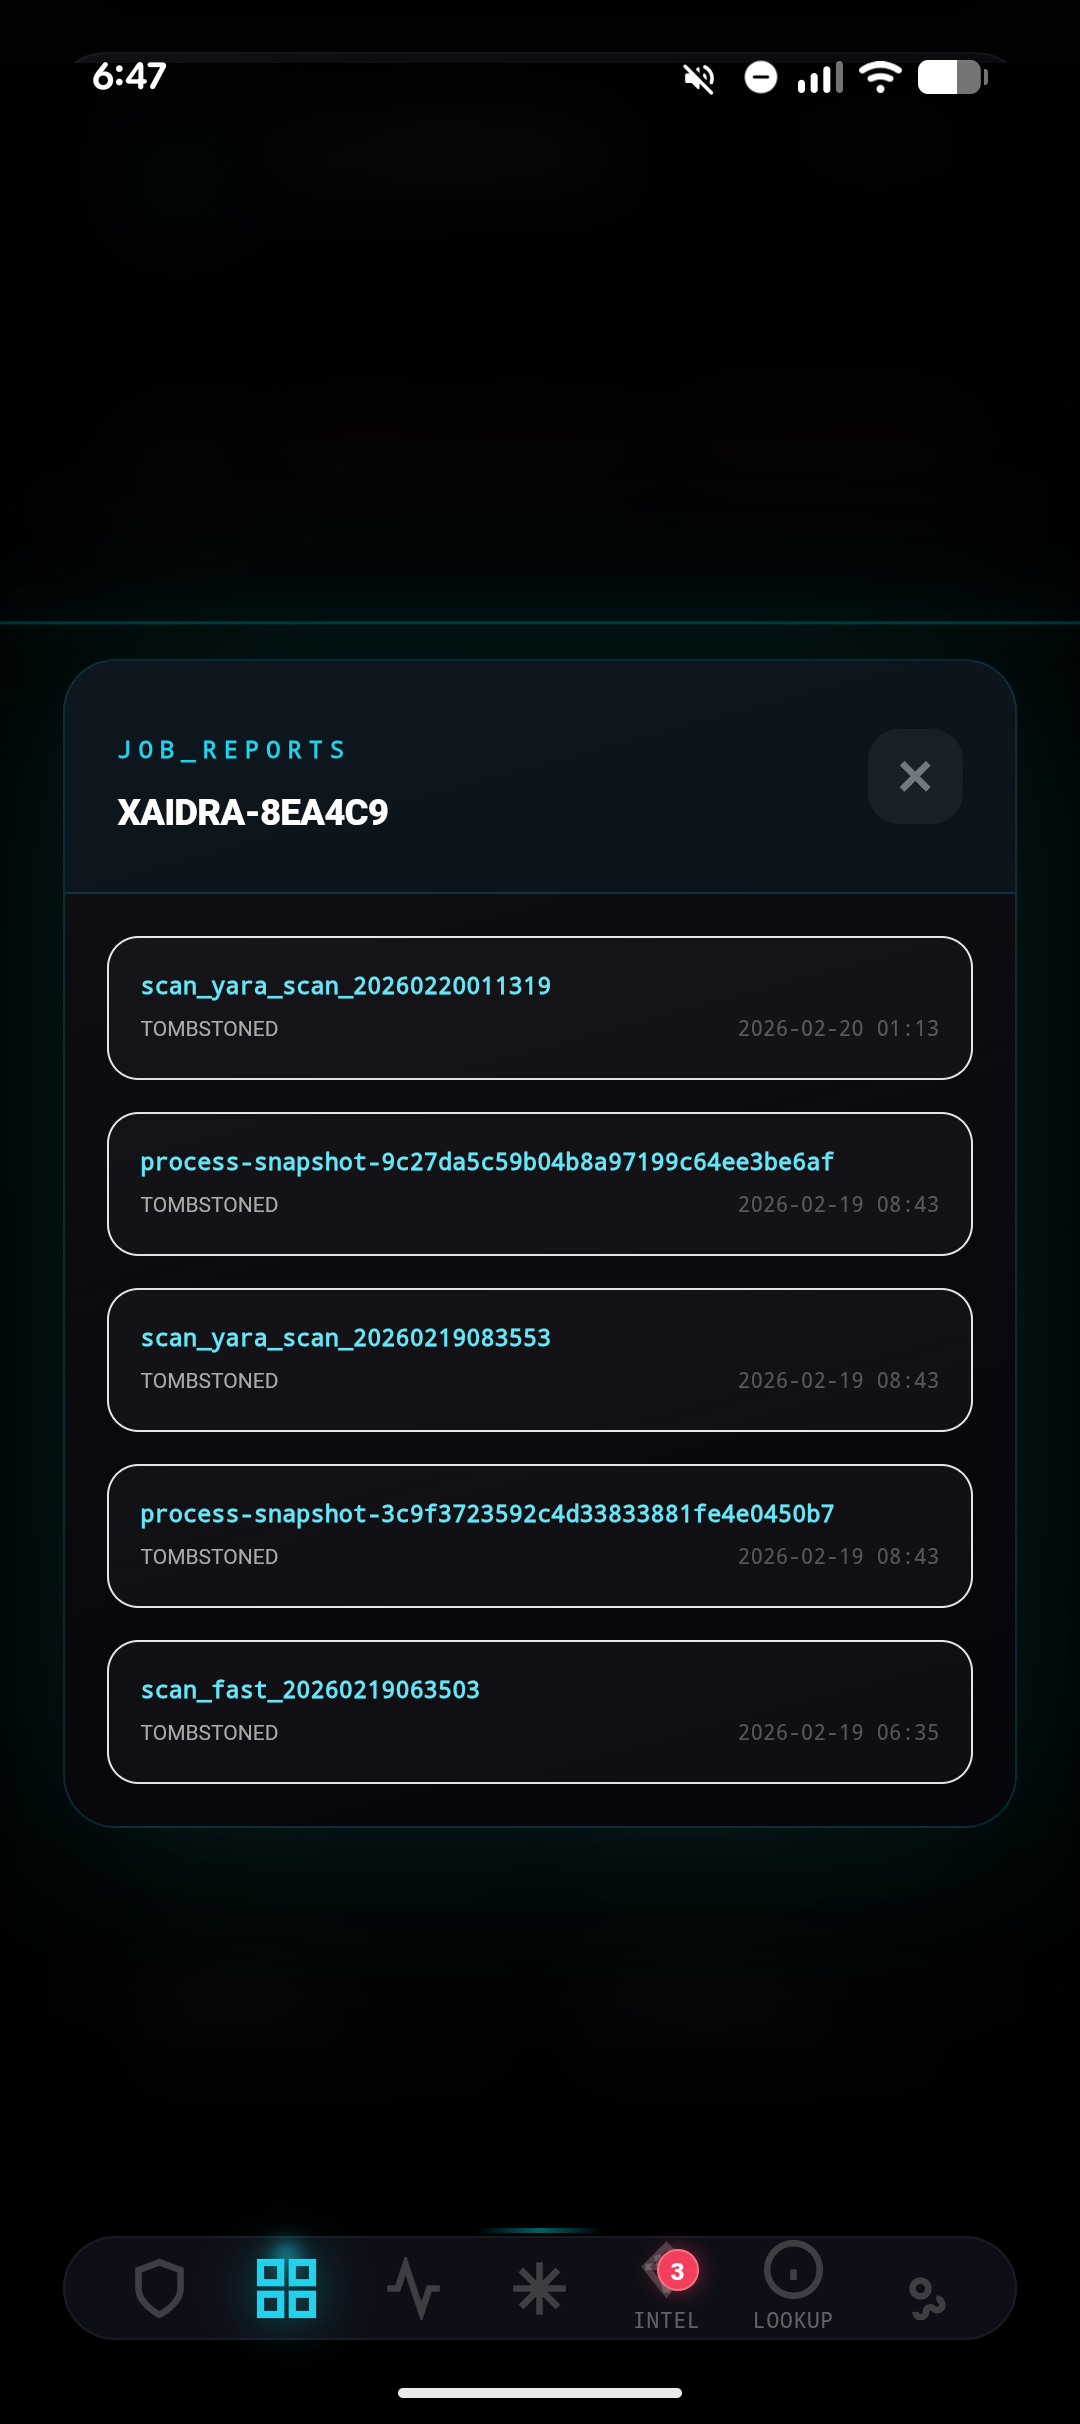
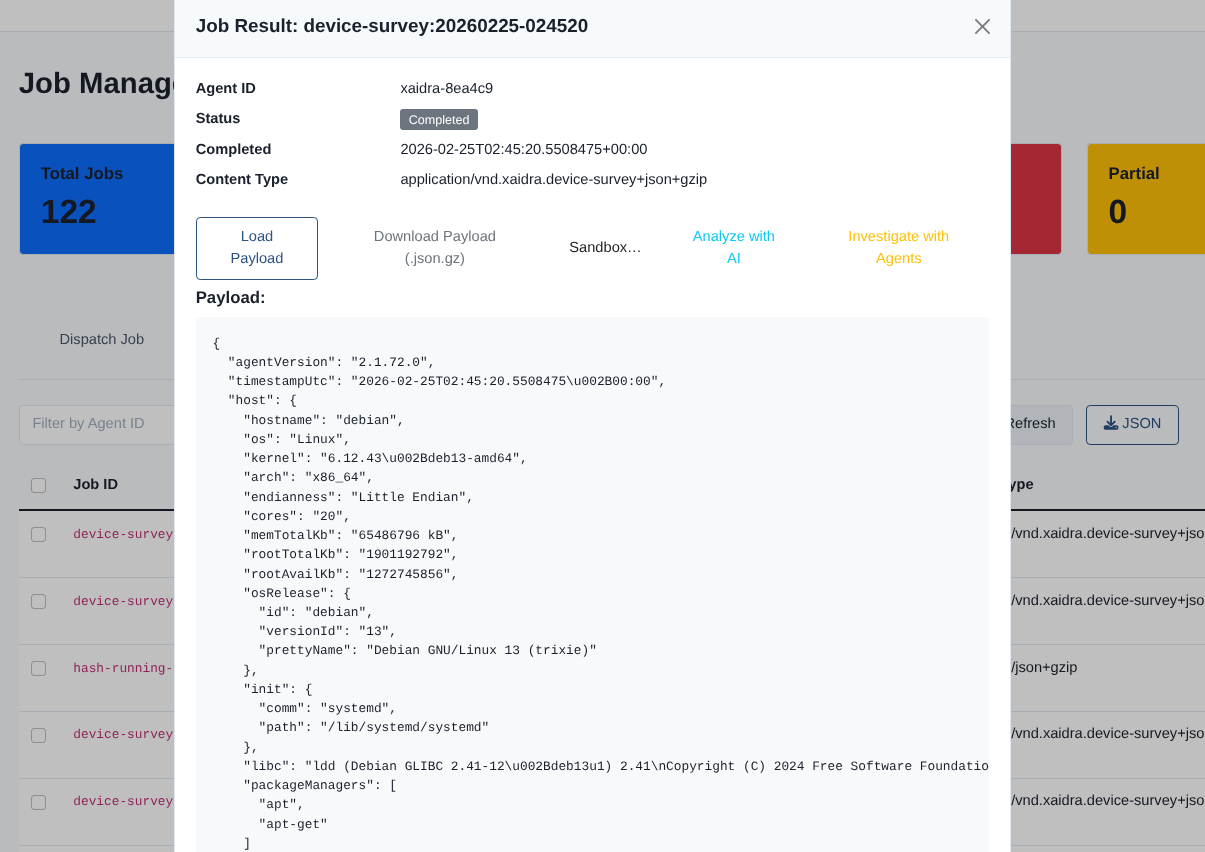
// JOB_RESULTS
Structured output and evidence packages from completed jobs.
// AGENT_ONBOARD
One-command agent deployment to any Linux node.
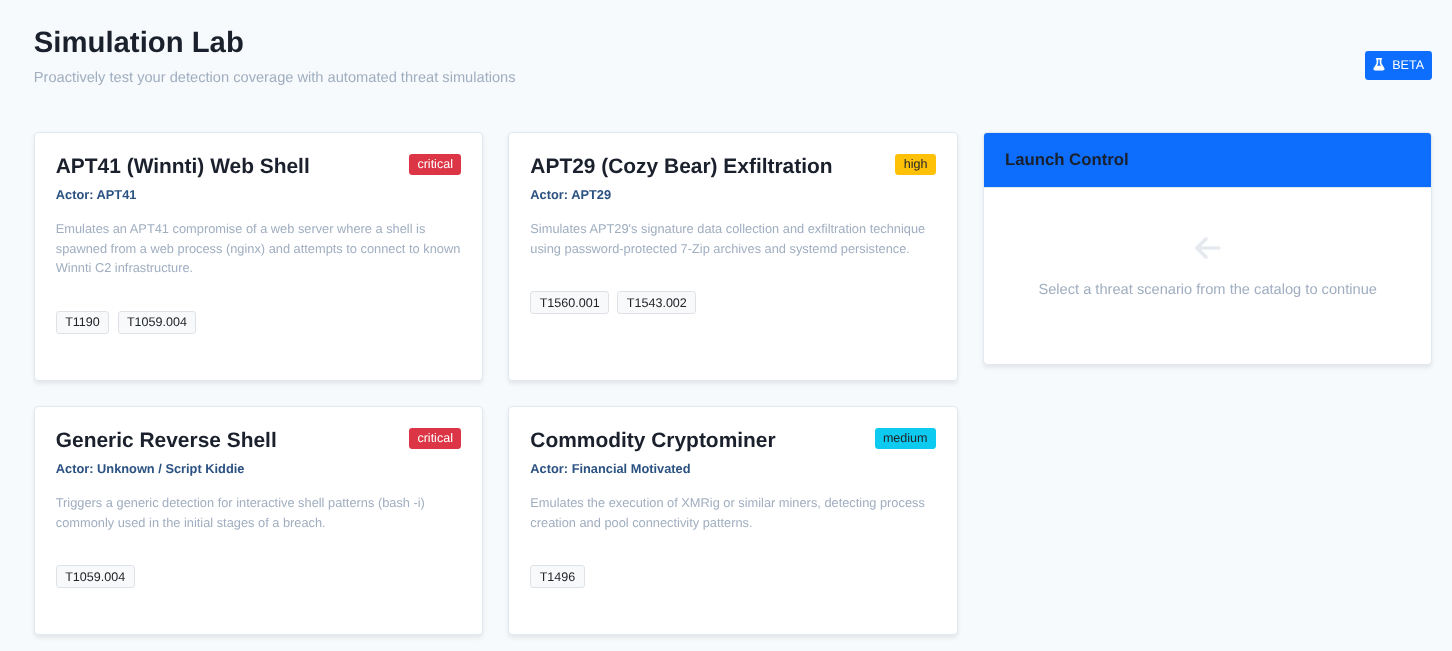
// ATTACK_SIMULATION
Validate detection coverage by replaying known attack patterns.
These views show the dashboard screens used for scan review, selective sweep configuration, threat intelligence, sandbox-style workflows, and IOC inspection. They are intended to help analysts understand what each module does before they open it live.
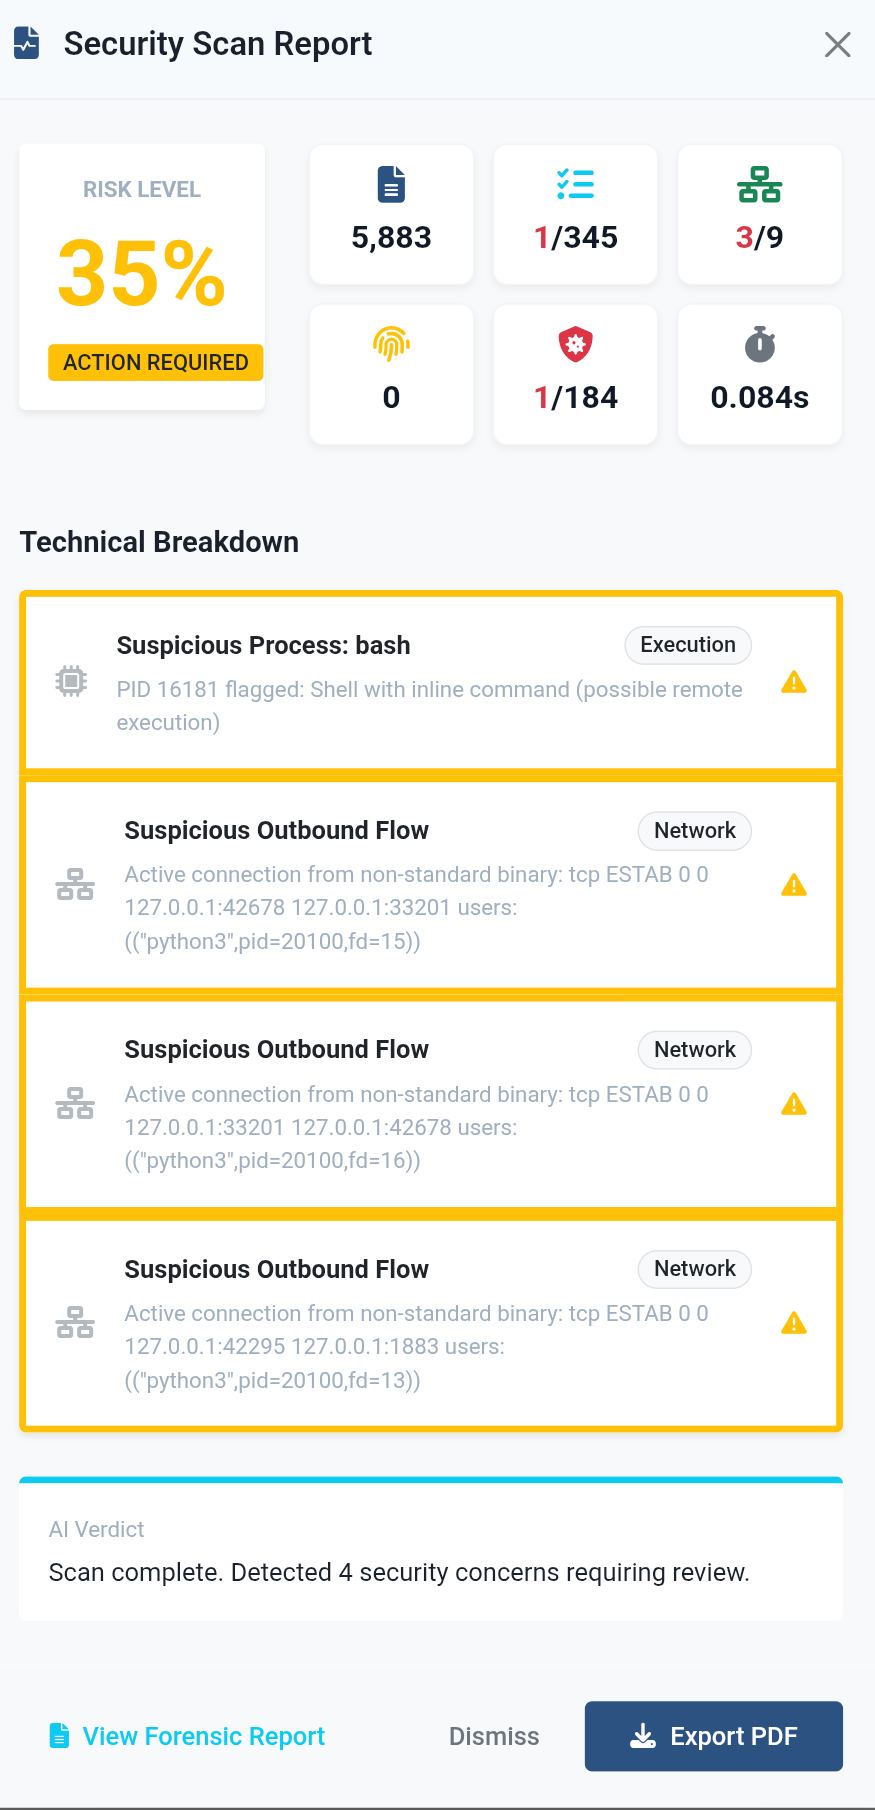
Scan Report
Shows the final scan outcome, metrics, and evidence summary so an analyst can decide whether to continue triage or close the event.
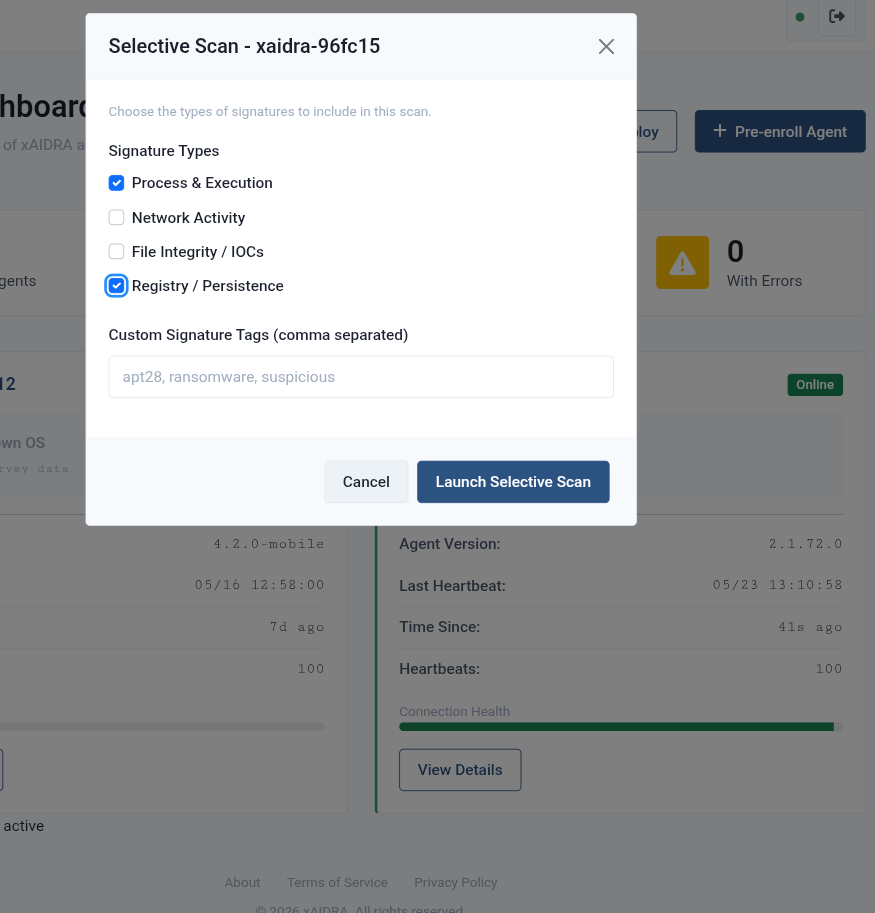
Selective Sweep
This screen is for scoped hunts where the analyst picks the target, engine scope, and relevant rule set instead of launching a broad default scan.
Network Analysis
Captures the workflow used to inspect a suspicious network path, review related flows, and correlate them with the rest of the host evidence.
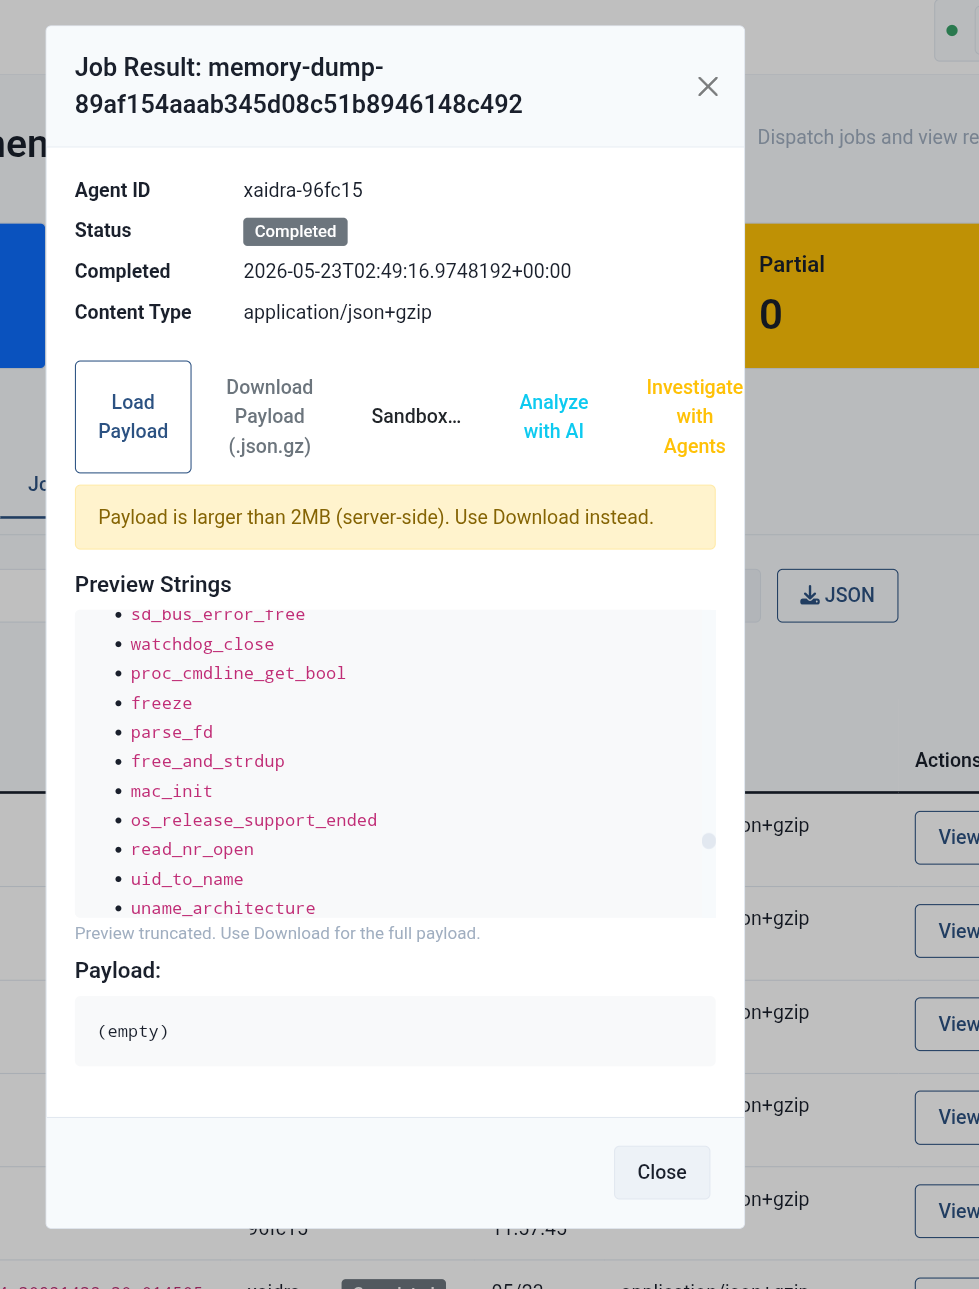
Memory Dump
Useful when the investigation needs a volatile snapshot, with the operator able to track status, completion, and related result artifacts.
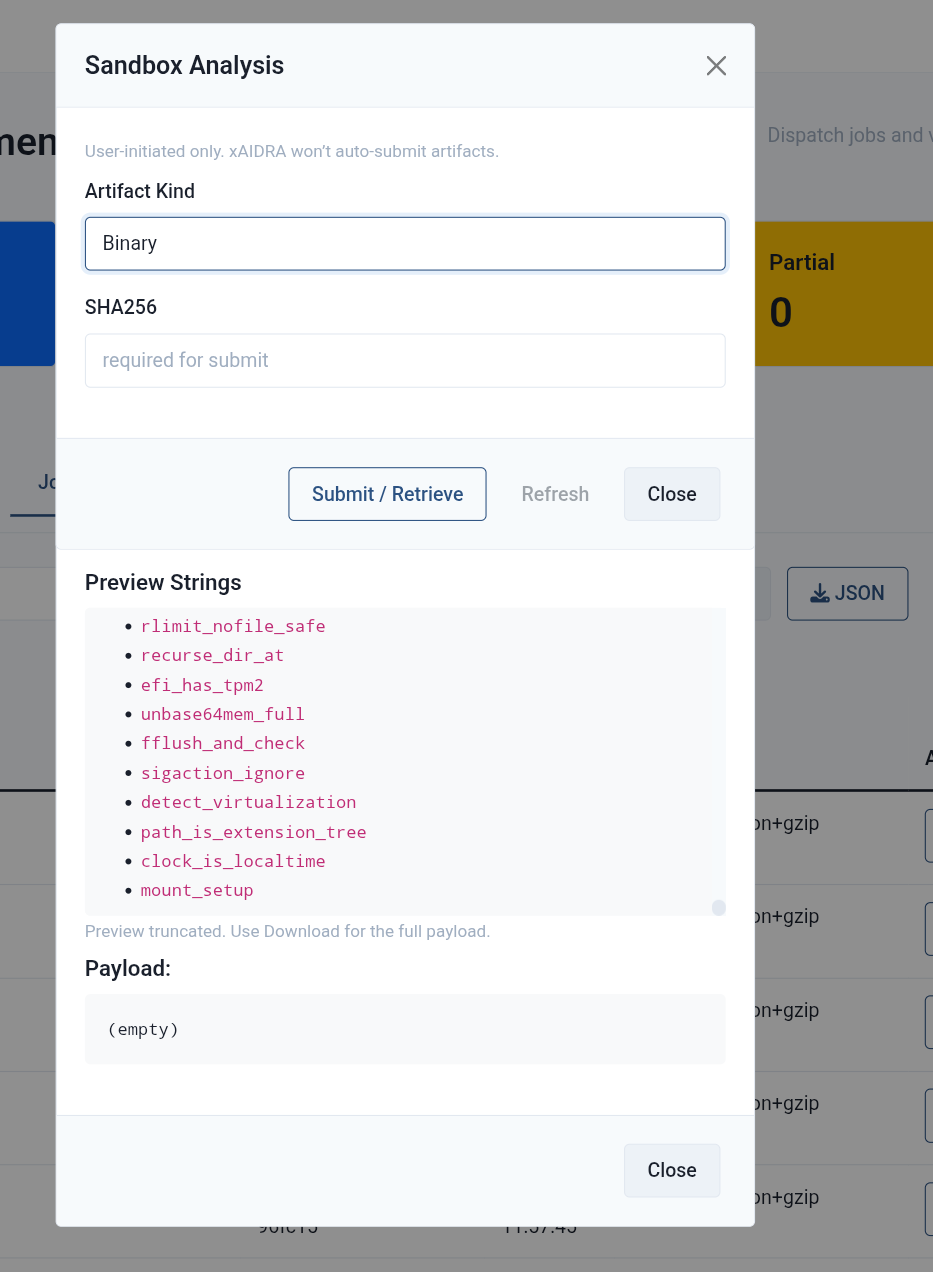
Sandbox
Represents an isolated workflow for inspecting artifacts safely before they are treated as broader indicators or response actions.